The Fxsloka 20–50–200 EMA Strategy: A Phase-Wise Guide for Day Traders
Moving averages are among the most widely used tools in trading, but they are also among the most misunderstood. Many beginners add a few EMAs to their chart and expect them to act like automatic buy and sell signals. They assume that if price touches the moving average, it must bounce, or if price crosses it, the trend must reverse. This is exactly why most traders get chopped up early in their journey.
The truth is that moving averages are not meant to predict price. They are meant to provide structure. When used correctly, the combination of the 20 EMA, 50 EMA, and 200 EMA can create one of the cleanest and most balanced frameworks for day trading. This guide breaks down the Fxsloka EMA model phase by phase, so even a new trader can learn how to apply it with clarity and discipline.
Phase 1: Understanding What the Three EMAs Represent
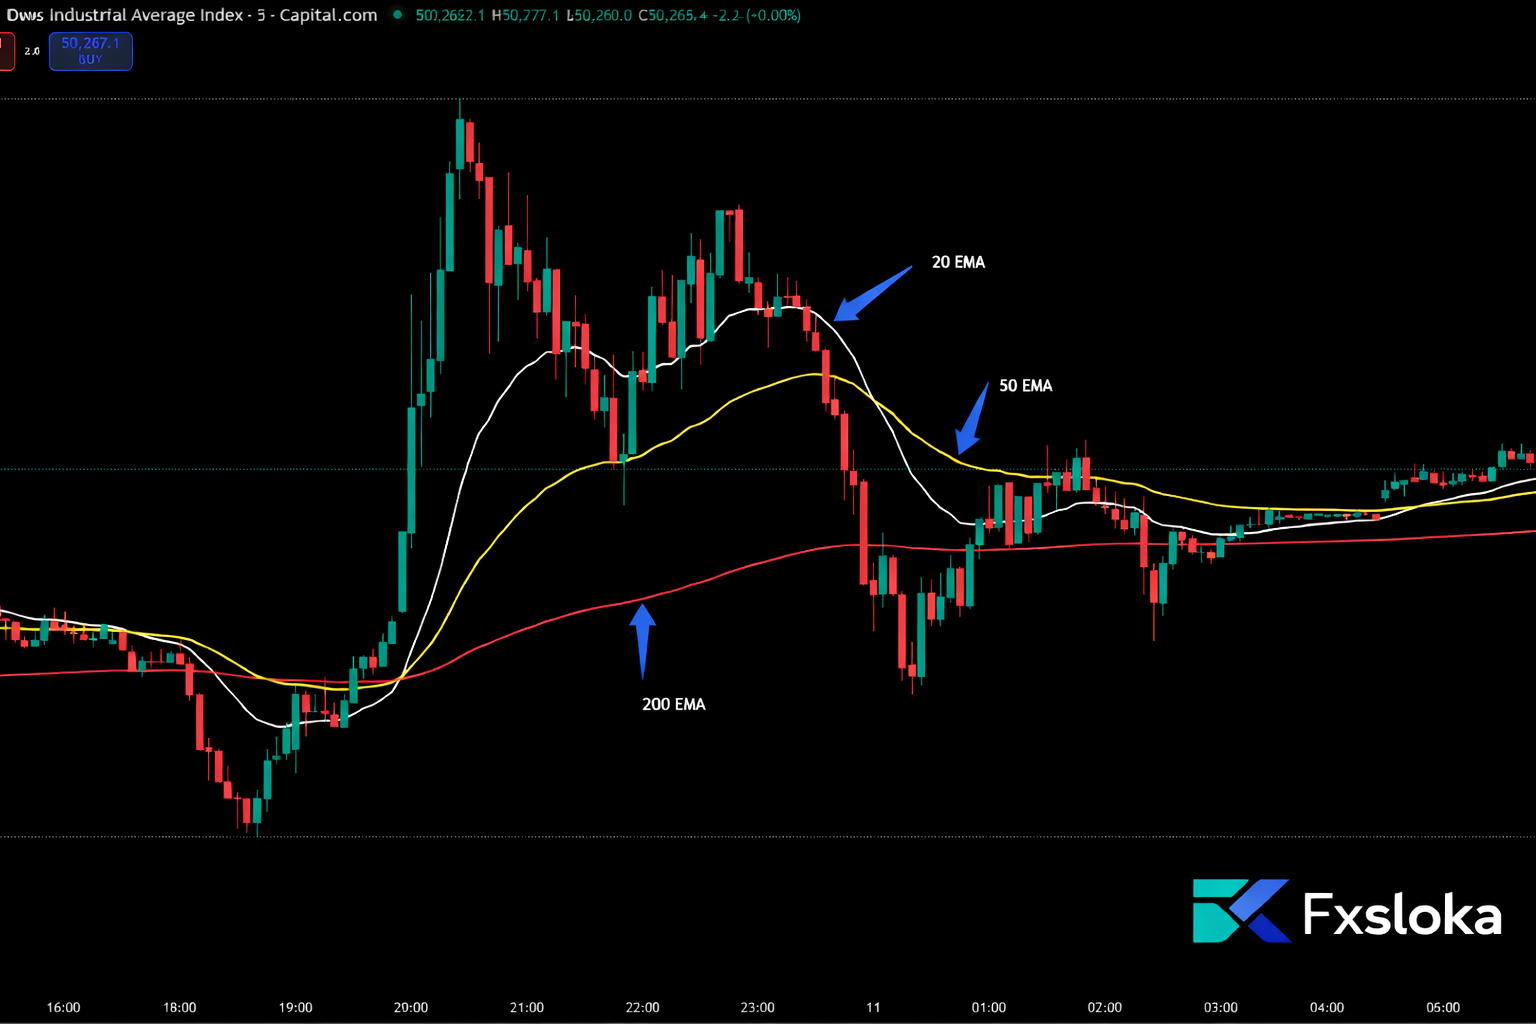
Before using this strategy, it is important to understand what each moving average actually represents in the market. The 20 EMA reflects short-term momentum. It tracks price closely and helps traders see the immediate trend flow. The 50 EMA represents the medium-term trend structure. It moves slower and acts as a stability filter, showing whether the trend has real strength or is simply noise. The 200 EMA is the most important of all, as it defines the broader market territory. It is watched by institutions, algorithms, and professional traders because it often separates bullish conditions from bearish ones.
When these three EMAs are used together, they do not provide signals. They provide context. They help you understand whether the market is trending cleanly, whether pullbacks are healthy, and whether you should even be trading at all.
Phase 2: Starting With Market Bias Using the 200 EMA
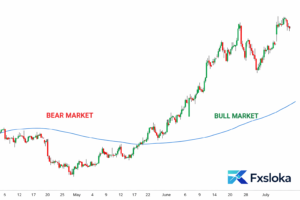
Every successful trade begins with bias. The biggest mistake new traders make is entering trades without knowing what kind of market they are in. The 200 EMA solves this problem by acting as a directional boundary. When price is trading above the 200 EMA, the market is generally operating in bullish territory. This means that buyers have control, and long setups tend to have higher probability. When price is trading below the 200 EMA, the market is in bearish territory, meaning sellers dominate and short setups perform better.
The most important lesson here is that the 200 EMA is not something you trade off directly. It is something you use to filter your decisions. If price is chopping back and forth around the 200 EMA, the market is telling you that there is no clear direction. In those conditions, trading becomes gambling. The first job of the trader is to avoid unclear markets, not to force trades inside them.
Phase 3: Confirming Trend Strength With the 20 and 50 EMA
Once the market bias is clear, the next step is determining whether the trend is strong enough to trade. This is where the relationship between the 20 EMA and the 50 EMA becomes critical. In a healthy bullish trend, the 20 EMA will stay above the 50 EMA, and both will slope upward. Price will respect the 20 EMA during pullbacks, showing that momentum remains intact. This alignment tells you that the market is trending, not ranging.
In a bearish trend, the opposite occurs. The 20 EMA stays below the 50 EMA, both slope downward, and price rejects the 20 EMA from underneath. This creates a clean structure where pullbacks become selling opportunities rather than reversal points.
If the 20 and 50 EMAs are tangled together or flat, that is a warning sign. It usually means the market is sideways, liquidity is low, and false signals will dominate. The trader’s edge disappears when the EMAs lose separation.
Phase 4: Identifying the EMA Value Zone (Where Professionals Enter)
The core of this strategy is understanding that the best trades do not happen at extremes. They happen at value. In trending markets, price moves in waves. It expands, then retraces, then expands again. The pullback phase is where professional traders look for entries.
In the Fxsloka EMA framework, the value zone is the area between the 20 EMA and the 50 EMA. This zone acts as dynamic support in an uptrend and dynamic resistance in a downtrend. When price pulls back into this region, it is often returning to an area where buyers or sellers can re-enter with strength.
The mistake beginners make is chasing the impulsive move. They buy after price has already surged or sell after it has already dropped. Professionals wait for the pullback into the EMA value zone, where risk is smaller and continuation probability is higher.
Phase 5: Waiting for Confirmation Instead of Guessing
One of the most important principles of successful trading is patience. The EMA zone provides the location, but it does not provide the entry trigger. Price must confirm that the pullback is complete. This confirmation often comes in the form of rejection candles, strong engulfing moves, or a break of minor intraday structure.
For example, in a bullish trend, price may pull back into the 20–50 EMA zone and print a long lower wick, showing rejection of lower prices. Shortly after, price may break a minor lower high, indicating that buyers are stepping back in. That is the moment a trader enters, not simply when price touches the EMA.
This phase is what separates structured trading from indicator gambling. The moving averages guide you to the right area, but price action tells you when the trade is real.
Phase 6: Risk Management and Stop Placement
No strategy works without risk control. New traders often place stops too tightly, directly on the EMA line, and get stopped out by normal volatility. The correct approach is to place the stop beyond the pullback structure. In a long trade, the stop belongs below the pullback low. In a short trade, it belongs above the pullback high.
This placement ensures that you are invalidated only when the setup truly fails, not when price simply wicks through the moving average zone.
Phase 7: Targeting Liquidity Instead of Random Exits
Exits are where many traders lose profitability. They either take profits too early out of fear or hold too long out of greed. The Fxsloka approach is to target logical liquidity zones. In an uptrend, targets are often previous highs, session highs, or clear resistance pools. In a downtrend, targets align with previous lows and support liquidity.
The goal is not to capture every pip. The goal is to capture the clean continuation move from value back into expansion.
Phase 8: Knowing When Not to Trade This Strategy
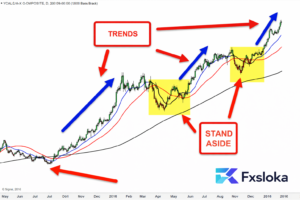
The 20–50–200 EMA strategy works best in trending environments. It fails in sideways chop. If the 200 EMA is flat and price is ranging, bias is unclear. If the 20 and 50 EMAs are tangled together, momentum is weak. These are conditions where traders should stand aside.
A professional trader’s success comes not only from taking good trades, but from avoiding bad environments.
Final Thoughts: Trading Successfully With the EMA Framework
The 20–50–200 EMA strategy is not a shortcut. It is a professional structure model. The 200 EMA gives you bias. The 20 and 50 EMAs give you trend strength. The zone between them gives you value. Price action gives you confirmation. Liquidity zones give you targets.
When applied with patience and discipline, this framework helps traders avoid noise, trade with trend, and build consistency over time.
Moving averages do not predict markets. They organise them. That is what makes this strategy so powerful for new traders.

